NBA Closing Line Value: Tracking Sharp Money and Measuring Betting Skill
 Available in US
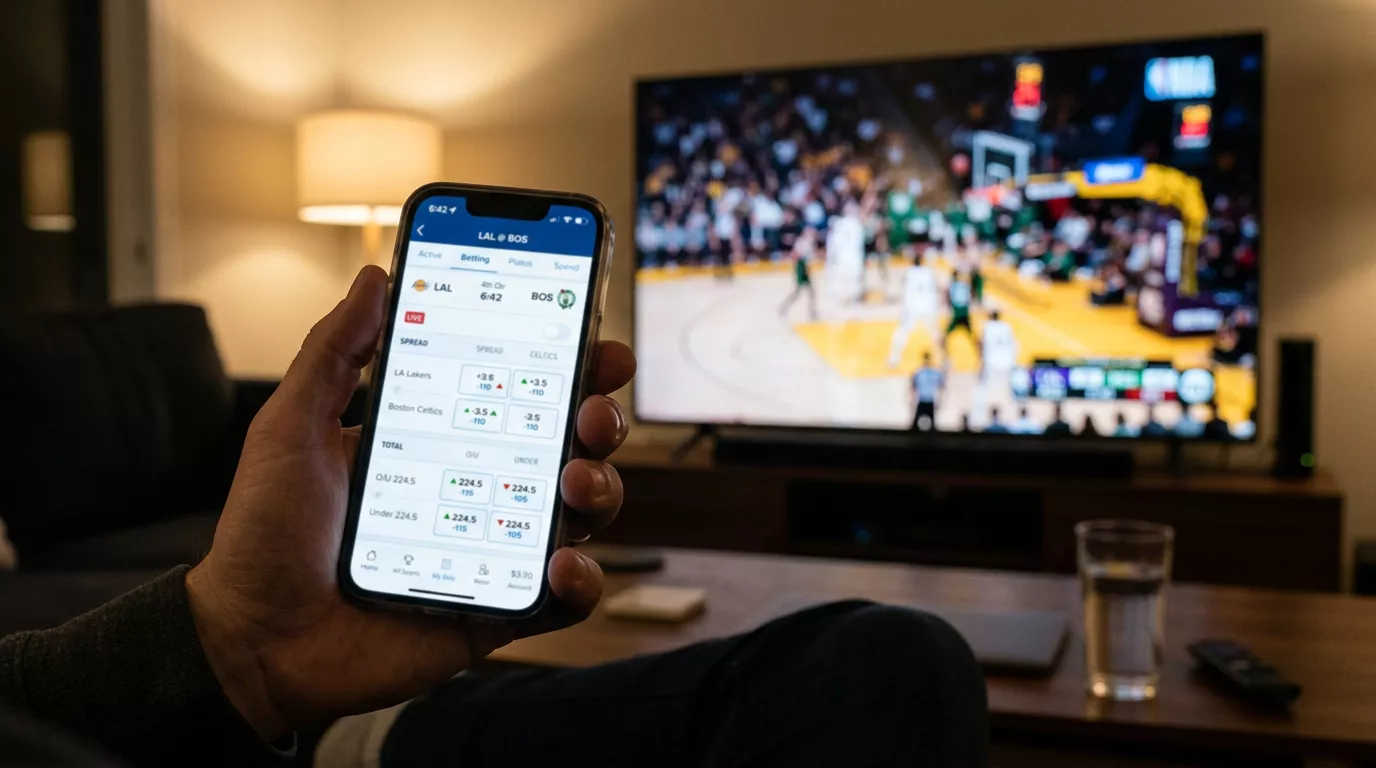
Two years into my NBA betting career, I was convinced I was profitable. My gut said so, my memory confirmed it, and the occasional big win reinforced the belief. Then I started tracking closing line value — the difference between the odds I took and the odds at tip-off — and the data told a different story entirely. I was consistently taking worse prices than the close. My bet selection was decent, but my timing was atrocious, and it was costing me real money. That discovery was uncomfortable and invaluable in equal measure.
Closing line value — CLV — is the professional bettor’s most trusted performance metric. It measures not whether your bets won, but whether you got a better price than the final market consensus. In a sport where live and in-play betting generates 62.35% of total online betting revenue, and where lines move constantly from open to close, the price you take matters as much as the selection you make.
What Closing Line Value Means and Why It Matters
Think of the NBA betting market as an auction that runs from the moment lines open until the game tips off. Early in the auction, the price is set by the bookmaker’s model — a decent estimate, but one that has not yet absorbed all available information. As the hours tick by, bettors place money on both sides, and the bookmaker adjusts the line to balance risk. By tip-off, the closing line reflects the combined intelligence of every sharp bettor, every model, and every piece of late-breaking information (injuries, lineup changes, weather in outdoor arenas — well, not that last one in the NBA, but you take the point).
The closing line is, on average, the most accurate prediction the market produces. Not perfect — games are inherently uncertain — but more accurate than the opening line, more accurate than any individual bettor’s assessment, and more accurate than any public model. This has been demonstrated empirically across multiple sports and millions of games. If you consistently take odds that are better than the closing line, you are extracting value from the market before it reaches its most efficient state. If you consistently take worse odds, you are on the wrong side of the market’s learning process.
Here is a concrete example. Suppose you back the Celtics at a spread of -4.5 in the morning, and by tip-off the line has moved to -6.0. You took -4.5 when the market eventually settled on -6.0, meaning you got 1.5 points of value. Even if the Celtics only win by 5 and your bet loses, the CLV analysis says you made a good bet — you had a price that the market later confirmed was generous. Over hundreds of bets, consistently positive CLV translates to profitability regardless of short-term variance.
Sharp Money vs Public Money in NBA Markets
Not all money moves lines equally. A recreational bettor placing fifty pounds on the Lakers moneyline barely registers on the bookmaker’s radar. A syndicate placing fifty thousand on the same market causes the line to shift immediately. Understanding who is moving lines — and why — is central to reading CLV signals.
Sharp money in NBA markets typically arrives in two waves. The first wave hits immediately after lines open, usually 18-24 hours before tip-off. This is when professional bettors with proprietary models exploit the biggest discrepancies between their projections and the bookmaker’s opening line. If the opening spread is Nuggets -5 and three sharp groups independently project Nuggets -7.5, they pile in on Denver, and the line moves to -6 or -6.5 within hours.
The second wave comes 30-90 minutes before tip-off, when late injury news, lineup confirmations and shoot-around reports become available. This wave tends to move player prop lines more than game spreads, because individual player availability has a direct, quantifiable impact on props. A late scratch of a team’s starting centre might barely move the spread but will significantly shift the opposing centre’s rebounds prop line. Sportradar’s billion-dollar NBA data deal ensures this information flows to bookmakers in near-real-time, and sharp bettors with their own data pipelines race to act on it before the line adjusts.
Public money — recreational bettors, accumulator players, casual fans — tends to arrive later, often within a few hours of tip-off. Public money gravitates toward favourites, overs, and big-name players, which is why popular teams like the Lakers and Warriors frequently see their moneyline odds shorten beyond what the underlying data supports. When public money pushes a line in one direction, the other side often represents closing line value for the sharp bettor willing to take the less glamorous position.
How to Track Your Own CLV
Tracking CLV requires two things: a record of the odds you took and a record of the closing odds at tip-off. The first is easy — it is your standard bet-tracking spreadsheet. The second requires a bit more effort, because you need to note the closing line for every game you bet on, which means checking odds in the minutes before tip-off.
My process is straightforward. I record my bet at the time I place it, including the exact decimal odds. Then, between five and fifteen minutes before tip-off, I note the closing odds at the same bookmaker. I calculate CLV as a percentage: ((my odds – closing odds) / closing odds) times 100. Positive numbers mean I beat the close; negative numbers mean I did not. Over a season of 400-plus bets, I target a cumulative CLV of at least positive 2%. That does not sound like much, but a sustained 2% CLV translates to roughly 3-5% ROI on flat stakes — a genuinely strong result in NBA betting.
The data from CLV tracking reveals patterns that win-loss records cannot. I discovered that my pre-game spread bets consistently beat the close by 1.5-2%, while my player prop bets consistently missed the close by 0.5-1%. The implication was clear: my edge lived in game-level analysis, not player-level analysis, and I needed to either improve my prop process or reduce my prop volume. Without CLV tracking, I would have continued splitting my action 50/50 between spreads and props, blissfully unaware that half my portfolio was dragging down the profitable half.
One important caveat: CLV is a long-term metric. Over 20 or 30 bets, the noise overwhelms the signal. You need at least 200-300 bets before CLV data becomes statistically meaningful, and ideally 500-plus before you draw firm conclusions about which market types, bet sizes or timing strategies are generating the most value. Patience with the data is as important as patience with the bankroll. For a broader look at how CLV fits into a complete betting framework, the strategy guide covers bankroll discipline, line shopping and the other pillars that support long-term profitability.
What is a good closing line value percentage in NBA betting?
A sustained CLV of positive 2% or higher across 300-plus bets indicates genuine skill. Professional bettors and syndicates typically achieve 3-5% CLV on their strongest markets. Even a small positive CLV, sustained over a large sample, translates to long-term profitability because the closing line is the market’s most efficient price. If your CLV is consistently negative, it suggests your timing or selection process needs adjustment regardless of your current win-loss record.
How do sharp bettors move NBA lines?
Sharp bettors move lines through volume and timing. They place large wagers — often five figures or more — immediately after lines open or in the minutes following late-breaking news like injury reports. Bookmakers monitor which accounts carry sharp histories and adjust lines more aggressively in response to their action. A single sharp bet can move a spread by half a point or more, while equivalent action from a recreational bettor might not move the line at all. This asymmetric response is why early line movement is considered a signal of informed opinion.
Prepared by the nba Game Betting editorial staff.